Spin–spin relaxation
Spin–spin relaxation is the mechanism by which Mxy, the transverse component of the magnetization vector, exponentially decays towards its equilibrium value of zero, in nuclear magnetic resonance (NMR) and magnetic resonance imaging (MRI). It is characterized by the spin–spin relaxation time, known as T2, a time constant characterizing the signal decay. It is named in contrast to T1, the spin-lattice relaxation time.
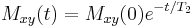
It is the time it takes for the magnetic resonance signal to reach 37% (1/e) of its initial value after its generation by tipping the longitudinal magnetization towards the magnetic transverse plane. Hence the relation:
T2 relaxation generally proceeds more rapidly than T1 recovery, and different samples and different biological tissues have different T2. For example, fluids have the longest T2s (in the order of seconds for Protons), and water based tissues are in the 40-200 ms range, while fat based tissues are in the 10-100 ms range. Amorphous solids have T2s in the range of milliseconds, while the transverse magnetization of crystalline samples decays in around 1/20 ms.
Contents |
Measuring spin–spin relaxation
A Hahn echo decay experiment can be used to measure the dephasing time, as shown in the animation below. The size of the echo is recorded for different spacings of the two pulses. This reveals the decoherence which is not refocused by the  pulse. In simple cases, an exponential decay is measured which is described by the T2 time.
T2 weighted images
In MRI, T2 weighted images can be obtained by setting long repetition time(TR) ( >1500 ms) and echo time(TE) ( > 75 ms) values in conventional spin echo sequences, while in gradient echo sequences they can be obtained by using flip angles of less than 40° instead of 90° while setting TE values to above 30 ms.
T2 weighted images in MRI are often thought of as "pathology scans" because collections of abnormal fluid are bright against the darker normal tissue. In the MRI of prostate cancer, cancerous regions of the peripheral zone of the gland often appear as hypo-intense regions of the gland in T2 weighted MR images[1].
See also
References
- Ray Freeman (1999). Spin Choreography: Basic Steps in High Resolution NMR. Oxford University Press. ISBN 978-0-19-850481-8.
- Malcolm H. Levitt (2001). Spin Dynamics: Basics of Nuclear Magnetic Resonance. Wiley. ISBN 978-0471489221.
- Arthur Schweiger, Gunnar Jeschke (2001). Principles of Pulse Electron Paramagnetic Resonance. Oxford University Press. ISBN 978-0198506348.
- McRobbie D., et al. MRI, From picture to proton. 2003
- Hashemi Ray, et al. MRI, The Basics 2ED. 2004.
- ^ Kirkham, A. P. S., Emberton, M., and Allen, C. (2006). How good is MRI at detecting and characterising cancer within the prostate? European urology 50, 1163-74; discussion 1175. Available at: http://www.ncbi.nlm.nih.gov/pubmed/16842903 [Accessed October 10, 2010].